

 English
 French
 Spanish
 Russian
 Korean
 Japanese
Green Spring Technology Supplies Yeast-Derived Glutathione Ingredient Solutions
In today's era, where natural functional ingredients command significant attention, glutathione—as a core active component—has found applications across multiple critical sectors, including feed, food, pharmaceuticals, and health supplements. To address the market's growing demand for high-quality, sustainable raw materials, Green Spring Technology officially introduces its natural glutathione raw material solution sourced from brewer's yeast. Through innovative processes, this solution achieves dual breakthroughs in product performance and cost efficiency.
What can Green Spring Technology's Natural, Consistent Yeast Glutathione Solution offer you?
✨ Exceptional Cost Control
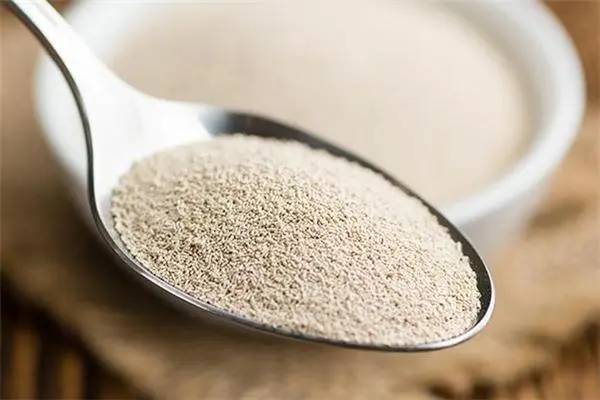
We innovatively utilize fresh brewer's yeast—a byproduct of beer brewing—as raw material. This eliminates the traditional strain cultivation step, directly synthesizing glutathione using highly active yeast cells. This breakthrough process significantly reduces production costs, providing customers with premium, competitively priced raw materials. It helps you maintain high product quality while achieving clear cost advantages.
✨ Stable Supply Assurance
Leveraging China's abundant yeast resources from over 30 million tons of annual beer production, we've established a robust supply chain. This unique advantage ensures a continuous, stable glutathione supply, eliminating production disruption risks from raw material shortages and providing reliable support for your product planning.
✨ Natural Origin Advantage
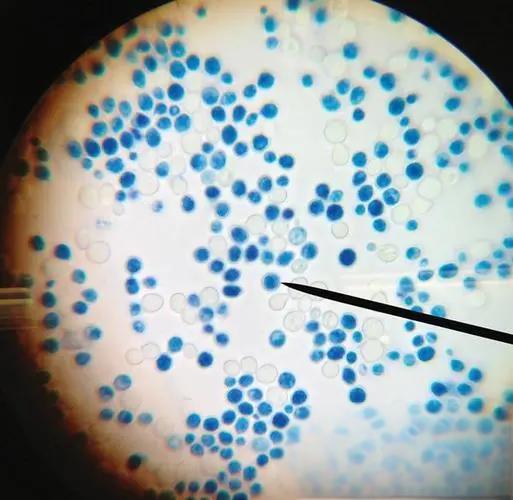
Our glutathione originates from brewer's yeast, possessing a natural source attribute. Yeast cells themselves are rich in nutrients such as proteins, essential amino acids, and yeast polysaccharides. This endows our product with excellent biocompatibility and absorption efficiency, making it particularly suitable for high-end feed, functional foods, and health supplements.
✨ Eco-Friendly Product Positioning
By transforming brewing byproducts into high-value glutathione raw materials, we not only achieve resource recycling but also provide customers with an environmentally sustainable ingredient choice. This green attribute effectively enhances your product's brand value, meeting growing consumer demand for eco-conscious products.
✨ Strict Quality Consistency
We maintain a comprehensive quality control system, enforcing rigorous standards at every stage from raw material selection to production processes. This ensures consistent activity and purity in every batch, providing reliable assurance for your product quality.
Green Spring Technology is committed to delivering truly competitive raw material solutions through continuous technological innovation. By choosing us, you gain not only premium ingredients but also a trusted partner to enhance your product's market competitiveness.
1 Pioneering Sustainable Production Solutions for Natural Yeast Glutathione
Fermentation has emerged as the global mainstream process for producing natural glutathione due to its mild conditions, scalability, and green economy advantages. Green Spring Technology deeply focuses on yeast fermentation technology, dedicated to transforming this advanced process into stable, efficient industrial production capacity.
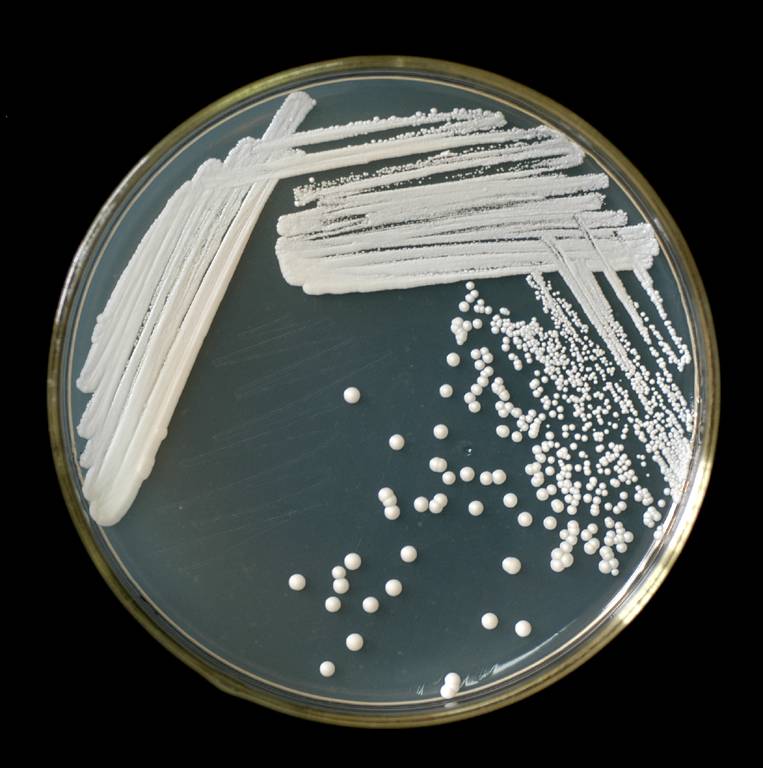
Traditional glutathione fermentation production often relies on standardized yeast strains and complex nutritional regulation. Green Spring Technology has pioneered a novel approach, innovatively exploring and optimizing a new pathway for synthesizing glutathione using brewer's yeast. We have thoroughly investigated comprehensive cultivation protocols, including carbon-nitrogen source ratios, key metal ions, and precursor amino acid addition strategies, to fully activate the yeast cells' synthetic potential.
Crucially, through systematic single-factor experiments and precise response surface optimization, we have successfully established a highly efficient synthesis process tailored for brewer's yeast. This not only significantly increased glutathione yield but also enabled precise control over the production process, ensuring the final product's exceptional natural quality and high batch-to-batch consistency.
Leveraging this technological breakthrough, Green Spring Technology can consistently supply customers with high-activity, high-purity natural yeast glutathione raw materials, providing a solid foundation for the outstanding performance of downstream products.
2 Refining Fermentation Processes, Strictly Controlling Quality to Produce High-Activity Yeast Glutathione
Green Spring Technology remains committed to systematically optimizing fermentation processes and implementing a rigorous scientific production control system to consistently deliver high-activity, high-quality natural yeast glutathione raw materials. We leverage data-driven approaches to achieve precise control throughout the entire production process, ensuring products exhibit outstanding biological activity and exceptional batch-to-batch consistency.
2.1 Precise Control of Core Fermentation Parameters
We have established optimal control ranges for key fermentation parameters, laying a solid foundation for stable, large-scale production:
· Carbon source concentration (glucose): 22–28 g/L
· Magnesium ion concentration (magnesium sulfate): 2.0–3.0 g/L
· Culture temperature: 26–30°C
Through continuous fermentation monitoring, we determined a 24-hour cycle as the optimal fermentation period. This cycle ensures peak glutathione synthesis while significantly enhancing production efficiency and resource utilization.
2.2 Systematic Optimization of Critical Culture Conditions
Green Spring Technology established a high-precision predictive model (R² = 0.9969, P < 0.0001) using response surface methodology to further optimize key process parameters:
· Glucose concentration: 24.66 g/L
· Magnesium sulfate concentration: 2.41 g/L
· Fermentation temperature: 28.10°C
Under these conditions, total glutathione reached 198.62 mg/L, closely matching the predicted value and validating the precision and reliability of process control.
2.3 Scientific Design of Precursor Amino Acid Addition Strategy
We employed a Box-Behnken experimental design to optimize the concentrations and timing of three precursor amino acids, establishing an efficient synthesis promotion scheme:
2.3.1 Optimal Concentration Ratios
· Glycine: 12.64 mmol/L
· Glutamic acid: 6.30 mmol/L
· Cysteine: 3.72 mmol/L
Under this ratio, total glutathione reached 315.65 mg/L, with model prediction accuracy (R² = 0.9972).
2.3.2 Optimal Addition Timing
Systematic studies confirmed that adding precursor amino acids at 21 hours of cultivation yielded 315.87 mg/L glutathione, representing a 52.51% increase over the control group.
2.4 Stability Control of Raw Materials and Process
2.4.1 Raw Material Freshness Management
· Limit storage time of brewer's yeast raw material to ≤ 5 days
· Control decline rate of all indicators within 10% during storage period
· Do not use expired raw materials to ensure stable fermentation activity
2.4.2 Process Priority Control
Based on multi-round experimental analysis, the influence order of key parameters is established as:
· Fermentation stage: Magnesium sulfate concentration > Temperature > Glucose concentration
· Amino acid phase: Cysteine concentration > Glycine concentration > Glutamic acid concentration
2.4.3 Dissolved Oxygen and Nutrient Regulation
· Dissolved oxygen control: Optimal at 8% liquid volume, achieving total glutathione of 212.07 mg/L
· Ion regulation: Magnesium sulfate concentration at 2.5 g/L effectively activates key synthetic enzyme activity
2.5 Scientific Cost Control Strategy
Experiments confirm that peptone concentration has limited impact on glutathione yield. While ensuring product quality, Green Spring Technology achieves cost control by optimizing medium composition, providing customers with more competitive raw material solutions.
Leveraging deep fermentation process expertise and full-process precision control, Green Spring Technology enables efficient synthesis and quality control of natural yeast-derived glutathione. We guarantee that every batch of raw materials undergoes strict process control and quality inspection, providing downstream customers with stable-performance, reliably supplied premium raw material solutions.
3 Green Spring Technology Provides High-Activity, High-Stability Yeast-Derived Glutathione Raw Material Solutions
Through systematic process innovation, Green Spring Technology has successfully developed yeast-derived glutathione raw materials with outstanding performance, offering customers in the feed, food, and health supplement industries a raw material choice with significant competitive advantages.
3.1 Higher Yield, Greater Cost Advantage
Through precision optimization of fermentation processes, we have achieved significant increases in glutathione yield:
· Optimized basal medium: Glutathione yield reached 198.62 mg/L, a 93.93% improvement over traditional processes
· Precursor amino acid strategy optimization: Further increased yield to 315.65 mg/L, representing a cumulative 208.19% improvement
Value to you: Higher fermentation efficiency translates to lower raw material costs, providing core support for creating more price-competitive end products.
3.2 Strict Quality Control Ensures Batch Consistency
We have established a comprehensive quality assurance system to guarantee stable and reliable raw material performance:
· Precise process control: Optimal parameters determined via response surface methodology, including glucose concentration 24.66 g/L, magnesium sulfate concentration 2.41 g/L, and temperature 28.10°C
· Standardized production workflow: 24-hour fermentation cycle established to ensure production efficiency and product stability
· Raw material freshness management: Strictly limiting yeast raw material usage to within 5 days of production to guarantee product activity from the source
What Does This Mean for You?
Consistent product quality ensures uniform performance in your end products, eliminating frequent formulation adjustments and reducing production risks.

3.3 Scientifically Validated, Proven Efficacy
All processes undergo rigorous experimental validation to guarantee reliable outcomes:
· Precise amino acid precursor ratios: Glycine 12.64 mmol/L, Glutamic acid 6.30 mmol/L, Cysteine 3.72 mmol/L
· Optimal addition timing: Added 21 hours post-incubation for maximum synthesis efficiency
· Comprehensive performance enhancement: Simultaneously optimizes intracellular content, cell biomass, and total glutathione levels
Value to You: Scientifically validated raw material performance provides robust data support for your product formulation's efficacy claims.
Why Choose Green Spring Technology's Yeast-Derived Glutathione?
· Cost advantage: High-yield process delivers competitive pricing
· Consistent Quality: Strict production controls ensure batch-to-batch uniformity
· Proven Efficacy: Scientifically optimized processes guarantee product bioactivity
· Reliable Supply: Mature production technology ensures continuous, stable availability
Act now to infuse your products with core competitive advantages!
Contact us at helen@greenspringbio.com or WhatsApp: +86 13649243917 to receive:
· Complimentary sample trials;
· Detailed technical documentation;
· Customized application solutions.
Discover Green Spring Technology's full range of traceable glutathione solutions to infuse your products with stable competitiveness.
-
Prev
Green Spring Technology: Guaranteeing Your Supply of High-Bioavailability CoQ10 Powder
-
Next
Green Spring Technology's Glutathione Ingredient Solutions: Empowering Your Wellness Products